Sea Ice Dynamics
To address these concerns, a discrete element method model of sea ice motion in the Arctic basin (Siku – after the Inuit work for sea ice) was developed for the Coastal Marine Institute and Bureau and Ocean Energy Management. Siku is a coupled ocean-atmosphere model used to forecast the dynamics of sea ice motion due to winds, ocean currents and internal stresses, including the fracture behavior of the ice pack.
Siku is the first DEM model of sea ice that takes into account the spherical geometry of the Earth, which allows simulations ranging from basin scale to meter scale depending on the problem requirements.
Cracks within an ice sheet occur along contacts between unit cell floes that makeup the ice cover, when internal stresses exceed the specified failure stress at floe contacts. Siku’s ice sheet failure process provides a more physically based method to simulate sea ice fracture processes than traditional continuum sea ice dynamics models.
Siku’s capabilities allow it to solve a much wider range of problems than previous DEM and continuum based sea ice models. Such problems include retrospective analysis of old Earth or any other planet significantly covered by ice, ice-infrastructure interaction, Arctic basin scale ice movement, and ice-climate processes. For more information about Siku please contact us at info@coupi.us.
Figure 1: A time sequence (from top panel to bottom) showing the crack growth (dark blue) in a sea ice sheet initiated at a projection from the North coast of Alaska. Wind direction and magnitude over the ice and land is shown using arrows with length proportional to wind speed. .
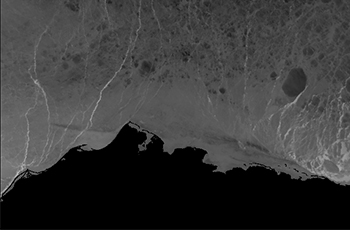
Figure 2 .
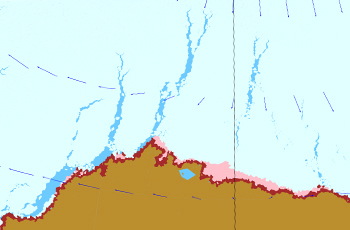
Figure 3 .
Figures 2 and 3: Fracture patterns (lead formation) observed from satellite imagery (left panel) compared with a Siku simulation (right panel) of ice motion and lead formation for February 17, 1994. Leads in the satellite image are shown as light toned tendrils extending from the Alaskan coastline. Leads are shown as dark blue tendrils from the coastline in the Siku simulation image.
.
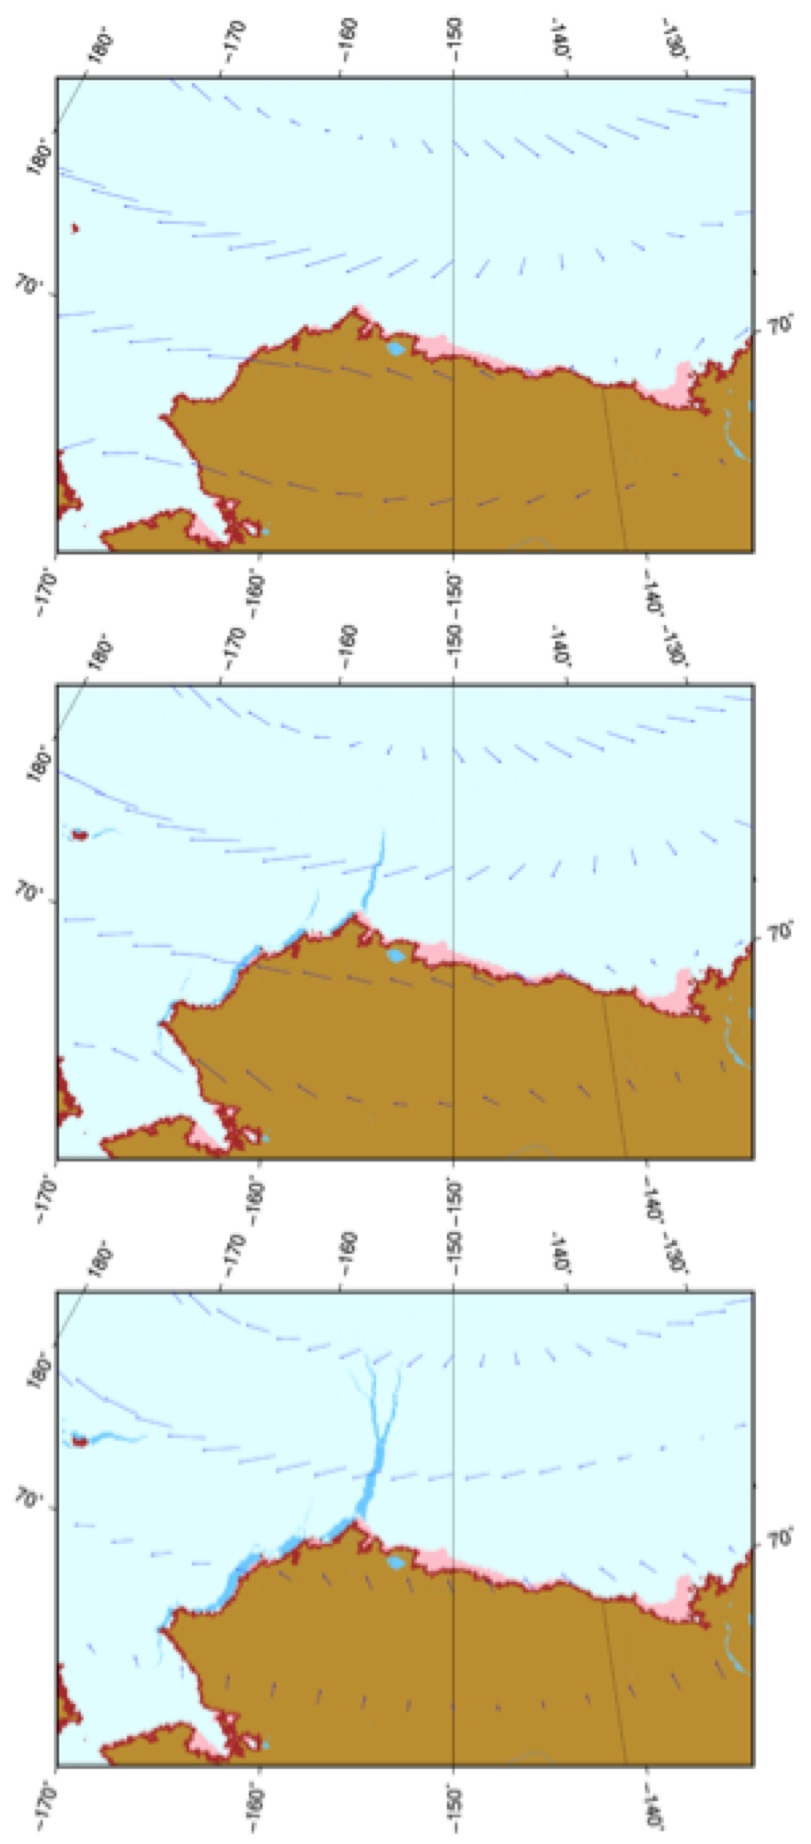
Figure 1 .